First Year Class of 2026 Profile


Stats

Statistics

Statistic General Category Access Category Black Applicant Category

Indigenous

Category

% of class admitted in this category 77% 13% 9% 1%


Age and Gender

Class Profile

Class  

of '26

Class  

of '25

Class  

of '24

Class  

of '23

Class  

of '22

Class  

of '21

Class  

of '20

Class  

of '19

Class  

of '18

Class  

of '17

Class  

of '16

Class  

of '15

Age 24 23 23 24 23 23 23 23 23 24 23 23
Mature Age** 31 29 29 29 29 33 27 35 34 36 31 32
Female 51.6% 57% 58% 46% 48% 51% 47% 52% 51% 45% 48% 52%
Male 45.6% 42%

33%

49% 48% 49% 53% 48% 49% 55% 52% 48%
Transgender N/A 0.73% N/A N/A N/A N/A N/A N/A N/A N/A N/A N/A
Other 0.5% 0.73% N/A N/A N/A N/A N/A N/A N/A N/A N/A N/A
Unidentified 2.3% N/A 9% 5% 4% N/A N/A N/A N/A N/A N/A N/A

**Average age of those over 26

Demographic Profile: Queen's Law Class of '26

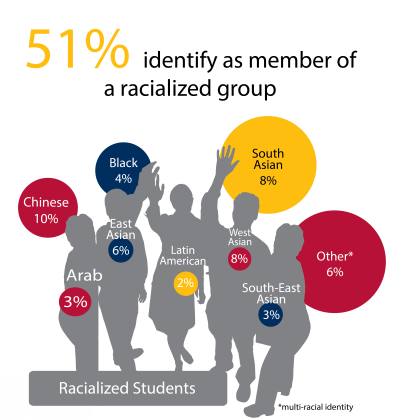
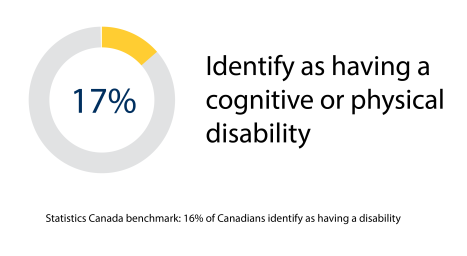
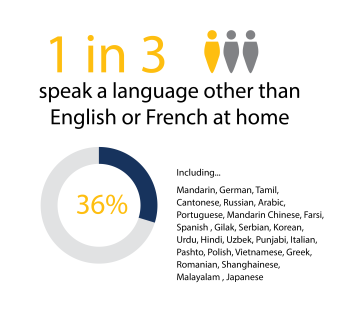
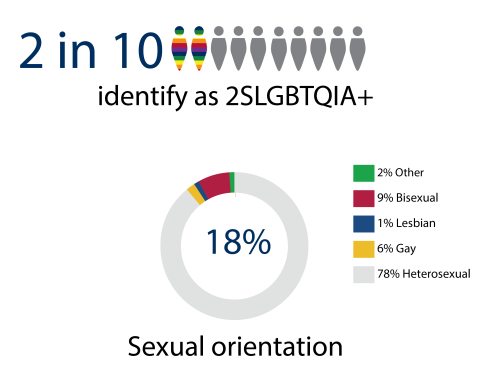
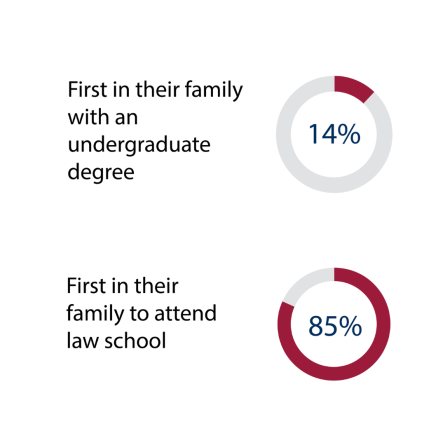
The Faculty of Law uses a combination of admissions data and the results of a 1L survey to produce a demographic snapshot of its incoming class. Queen’s Law offers an inclusive, innovative and collaborative learning environment that encourages free and respectful inquiry where all can flourish with equality and dignity. Please note that the numbers represented below are a breakdown of the statistical responses received to the demographic survey, and not total number of students in the Class of '26. 

DemoDisability


language


IcomeLGBTQ


Undergrade


Map


If you have any questions about diversity, equity, or how our Equity Office works to support students from all backgrounds at Queen’s Law, please feel free to contact Education & Equity Services.